I just got back from a trip to Lyon, France. I served on the thesis committee of newly minted doctor Bertrand Care, had some hearty Bouchon Lyonnais food, and gave a talk on steroid-mediated gene expression. The slides can be found here.
Month: November 2012
News as entertainment
This is an obvious observation but it struck me one day while watching the evening national news on multiple channels that the only thing that can differentiate between different programs cannot be news because true news is reported by everyone by definition. Half of all the news programs are identical and the other half covers random human interest stories. Given that the true news will have likely to have taken place earlier in the day, the actual news stories will not be novel. This clearly indicates that the national nightly news is doomed for extinction. Based on the commercials aired during the programs, the average demographic are senior citizens. Once they are gone, so will the nightly news, “and that’s the way it is“.
Economic growth and reversible computing
In my previous post on the debt, a commenter made the important point that there are limits to economic growth. USCD physicist Tom Murphy has some thoughtful posts on the topic (see here and here). If energy use scales with economic activity then there will be a limit to economic growth because at some point we will use so much energy that the earth will boil to use Murphy’s metaphor. Even if we become energy efficient, if the rate of increase in efficiency is slower than the rate of economic growth, then we will still end up boiling. While I agree that this is true given the current state of economic activity and for the near future, I do wish to point out that it is possible to have indefinite economic growth and not use any more energy. As pointed out by Rick Bookstaber (e.g. see here), we are limited in how much we can consume because we are finite creatures. Thus, as we become richer, much of our excess wealth goes not towards increase consumption but the quality of that consumption. For example, the energy expenditure of an expensive meal prepared by a celebrity chef is not more than that from the local diner. A college education today is much more expensive than it was forty years ago without a concomitant increase in energy use. In some sense, much of modern real economic growth is effective inflation. Mobile phones have not gotten cheaper over the past decade because manufacturers keep adding more features to justify the price. We basically pay more for augmented versions of the same thing. So while energy use will increase for the foreseeable future, especially as the developed world catches up, it may not increase as fast as current trends.
However, the main reason why economic growth could possibly continue without energy growth is that our lives are becoming more virtual. One could conceivably imagine a future world in which we spend almost all of our day in an online virtual environment. In such a case, beyond a certain baseline of fulfilling basic physical needs of nutrition and shelter, all economic activity could be digital. Currently computers are quite inefficient. All the large internet firms like Google, Amazon, and Facebook require huge energy intensive server farms. However, there is nothing in principle to suggest that computers need to use energy at all. In fact, all computation can be done reversibly. This means that it is possible to build a computer that creates no entropy and uses no energy. If we lived completely or partially in a virtual world housed on a reversible computer then economic activity could increase indefinitely without using more energy. However, there could still be limits to this growth because computing power could be limited by other things such as storage capacity and relativistic effects. At some point the computer may need to be so large that information cannot be moved fast enough to keep up or the density of bits could be so high that it creates a black hole.
Debt is relative
One of the memes that is dominating American political discourse is that the US national debt is too high. The debt is currently around 16 trillion dollars which exceeds the current GDP of 15 trillion. This may seem large but keep in mind that the debt-to-GDP ratio in Japan is over two. The federal government will bring in about 2.6 trillion in revenues this year but spend about 3.7 trillion dollars, giving us an annual deficit of a trillion dollars. However, our borrowing costs are also very low. The yield on a 10 year Treasury bond is under 2% and the 30 year yield is under 3%. The general fear of having large debt is that it may cause interests rates to rise because people fear a default. This then leads to higher borrowing costs until you get to a point where you can never repay the debt. This is where Greece is now and where Spain, Portugal, Ireland, and Italy may be heading.
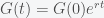
However, an important fact that should be kept in mind when thinking about debt is that the absolute amount is irrelevant. This is because economics, like biology, is about flux and growth. As long as the nominal GDP growth rate (real GDP growth plus inflation) exceeds the borrowing rate, then the debt ratio will shrink in the future. In fact the power of exponential growth shows that you can always be in deficit and the debt to GDP ratio can shrink. We can see this in a simple calculation. Let 


Prediction requires data
Nate Silver has been hailed in the media as a vindicated genius for correctly predicting the election. He was savagely attacked before the election for predicting that Obama would win handily. Kudos also go to Sam Wang, Pollester.com, electoral-vote.com, and all others who simply took the data obtained from the polls seriously. Hence, the real credit should go to all of the polling organizations for collectively not being statistically biased. It didn’t matter if single organizations were biased one way or the other as long as they were not correlated in their biases. The true power of prediction in this election was that the errors of the various pollsters were independently distributed. However, even if you didn’t take the data at face value, you could still reasonably predict the election. Obama had an inherent advantage because he had more paths to winning 270 electoral votes. Suppose there were 8 battleground states and Romney needed to win at least 6 of them. Hence, Romney had 28 ways to win while Obama had 228 ways to win. If the win probability was approximately a half in each of these states, which is what a lot of people claimed, then Romney has slightly more than one in ten chance of winning, which is close to the odds given by Sam. The only way Romney’s odds would increase is if the state results were correlated in his favour. However, it would take a lot of correlated bias to predict that Romney was a favourite.
Erratum, Nov 9 2012: Romney actually has 37 ways and Obama 219 in my example. The total must add up to 2^8=256. I forgot to include the fact that Romney could also win 7 of 8 states or all states in his paths to winning.
Predicting the election
The US presidential election on Nov. 6 is expected to be particularly close. The polling has been vigorous and there are many statistical prediction web sites. One of them, the Princeton Election Consortium, is run by neuroscientist Sam Wang at Princeton University. For any non-American readers, the president is not elected directly by the citizens but through what is called the electoral college. This is a set of 538 electoral voters that are selected by the individual states. The electoral votes are allotted according to the number of congressional districts per state plus two. Hence, low population states are over-represented. Almost all states agree that the candidate that takes the plurality of the votes in that state wins all the electoral votes of that state. Maine and Nebraska are the two exceptions that allot electoral votes according to who wins the congressional district. Thus in order to predict who will win, one must predict who will get at least 270 electoral votes. Most of the states are not competitive so the focus of the candidates (and media) are on a handful of so-called battleground states like Ohio and Colorado. Currently, Sam Wang predicts that President Obama will win the election with a median of 319 votes. Sam estimates the Bayesian probability for Obama’s re-election to be 99.6%. Nate Silver at another popular website (Five Thirty Eight), predicts that Obama will win 305 electoral votes and has a re-election probability of 83.7%.
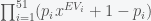
These estimates are made by using polling data with a statistical model. Nate Silver uses national and state polls along with some economic indicators, although the precise model is unknown. Sam Wang uses only state polls. I’ll describe his method here. The goal is to estimate the probability distribution for the number of electoral votes a specific candidate will receive. The state space consists of 


Hence, the coefficient of each term is the probability for the number of electoral votes given by the exponent of 
Most statistical models predict that Obama will be re-elected with fairly high probability but the national polls are showing that the race is almost tied. This discrepancy is a puzzle. Silver’s hypothesis for why is here and Sam’s is here. One of the sources for error in polls is that they must predict who will vote. The 2008 election had a voter turnout of a little less than 62%. That means that an election can be easily won or lost based on turnout alone, which makes one wonder about democracy.
Nov 4: dead link is updated
