For the past five weeks, the appearance rate of Covid-19 cases has plateaued at about a hundred thousand new cases per day. Just click on the Daily Cases Tab on the JHU site to see for yourself. This is quite puzzling because while individual nations and regions are rising, falling, and plateauing independently, the global total is flat as a pancake. A simple resolution to this seeming paradox was proposed by economist John Cochrane (see his post here). The solution is rather simple but the implications as I will go into more detail below are far reaching. The short answer is that if the world (either through behavior or policy) reacts to the severity of Covid-19 incrementally then a plateau will arise. When cases go up, people socially distance, and the number goes down, when cases go down, they relax a little and it goes back up again.
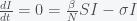
This can be made more precise with the now-famous SIR model. For the uninitiated, SIR stands for Susceptible Infected Recovered model. It is a simple dynamical model of disease propagation that has been in use for almost a century. The basic premise of an SIR model is that at any given time, the proportion of the population is either infected with the virus I, susceptible to infection S, or recovered from infection and no longer susceptible R. Each time an S comes across an I, it has a chance of being infected and becoming another I. An I will recover (or die) with some rate and become an R. The simplest way to implement an SIR model is to assume that people interact completely randomly and uniformly across the population and the rate of transmission and recovery is uniform as well. This is of course a gross simplification and ignores the complexity and diversity of social interactions, the mechanisms of actual viral transmission, and the progression of disease within individuals. However, even though it misses all of these nuances, it captures many of the important dynamics of epidemics. In differential equation form, the SIR model is written as

 (SIR model)
where  is the total number of people in the population of interest. Here,
  and
and  are in units of number of people. The left hand sides of these equations are derivatives with respect to time, or rates. They have dimensions or units of people per unit time, say day. From this we can infer that
  and
and  must have units of inverse day (per day) since , , and all have units of numbers of people. Thus is the infection rate per day and is the recovery/death rate per day. The equation assumes that the probability of an meeting an is
  . If there was one infected person in a population of a hundred, then if you were to interact completely randomly with everyone then the chance you would run into an infected person is 1/100. Actually, it would be 1/99 but in a large population, the one becomes insignificant and you can round up. Right away, we can see a problem with this assumption. I interact regularly with perhaps a few hundred people per week or month but the chance of me meeting a person that had just come from Australia in a typical week is extremely low. Thus, it is not at all clear what we should use for in the model. The local population, the regional population, the national population?
The model assumes that once an has run into an , the rate of transmission of the virus is . The total rate of decrease of is the product of and  . The rate of change of is given by the increase due to interactions with and the decrease due to recovery/death
  . These terms all have units of person per day. Once you understand the basic principles of constructing differential equations, you can model anything, which is what I like to do. For example, I modeled the temperature dynamics of my house this winter and used it to optimize my thermostat settings. In a post from a long time ago, I used it to model how best to boil water.
Given the SIR model, you can solve them to get how and will change in time. The SIR model is a system of nonlinear differential equations that do not have what is called a closed-form solution, meaning you can’t write down that  is some nice function like
  or
or  . However, you can solve them numerically on a computer or infer properties of the dynamics directly without actually solving them. For example, if
  is initially greater than , then $dI/dt$ is positive and thus $I$ will increase with time. On the other hand, since
  is always negative (rate of change is negative), it will decrease in time. As increases and decreases, since is decreasing at a faster rate than is increasing because is slowing the growth of , then at some point will equal and
  . This is a stationary point of . However, it is only a momentary stationary point because keeps decreasing and this will make start to decrease too and thus this stationary point is a maximum point. In the SIR model, the stationary point is given by the condition
 (Stationary condition)
which you can solve to get either  or
or  . The
. The  point is not a peak but just reflects the fact that there is no epidemic if there are no infections. The other condition gives the peak:
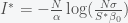

where  is the now-famous R naught or initial reproduction number. It is the average number of people infected by a single person since is the infection rate and is the infection disappearance rate, the ratio is a number. The stationary condition gives the herd immunity threshold. When the fraction of reaches
  then the pandemic will begin to decline. This is usually expressed as the fraction of those infected and no longer susceptible,
  . The 70% number you have heard is because
  is approximately 70% for
  , the presumed value for Covid-19.
A plateau in the number of new cases per day is an indication that we are at a stationary point in . This is because only a fraction of the total infected are counted as cases and if we assume that the case detection rate is uniform across all , then the number of new cases per day is proportional to . Thus, a plateau in cases means we are at a stationary point in , which we saw above only occurs at a single instance in time. One resolution to this paradox would be if the peak is broad so it looks like a plateau. We can compute how broad the peak is from the second derivative, which gives the rate of change of the rate of change. This is the curvature of the peak. Taking the second derivative of the I equation in the SIR model gives
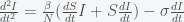
Using and the formula for  at the peak, the curvature is
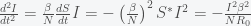
It is negative because at a peak the slope is decreasing. (A hill is easier to climb as you round the top.) There could be an apparent plateau if the curvature is very small, which is true if  is small compared to
  . However, this would also mean we are already at the herd immunity threshold, which our paper and recent anti-body surveys predict to be unlikely given what we know about .
If a broad peak at the herd immunity threshold does not explain the plateau in new global daily cases then what does? Cochrane’s theory is that depends on . He postulated that  ,where
  is the initial infectivity rate, but any decreasing function will do. When goes up, goes down. Cochrane attributes this to human behavior but it could also be a result of policy and government mandate. If you plug this into the stationary condition you get
or
and the effective reproduction number is one.
However, this is still only a quasi-stationary state because if is a constant  , then will decrease as
 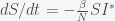 , which has solution
 (S)
(S)
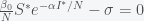
Plugging this into the equation for gives

which means that is not really plateaued but is decreasing slowly as
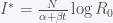
We can establish perfect conditions for a plateau if we work backwards. Suppose again that has plateaued at . Then,  is given by equation (S). Substituting this into the (Stationary Condition) above then gives
  or
or

which means that the global plateau is due to us first reducing to near , which halted the spread locally, and then gradually relaxing pandemic mitigation measures so that  is creeping upwards back to it’s original value.
The Covid-19 plateau is both good news and bad news. It is good news because we are not seeing exponential growth of the pandemic. Globally, it is more or less contained. The bad news is that by increasing at a rate of a hundred thousand cases per day, it will take a long time before we reach herd immunity. If we make the naive assumption that we won’t reach herd immunity until 5 billion people are infected then this pandemic could blunder along for  days! In other words, the pandemic will keep circling the world forever since over that time span, babies will be born and grow up. Most likely, it will become less virulent and will just join the panoply of diseases we currently live with like the various varieties of the common cold (which are also corona viruses) and the flu.

Nice paper (partly from an aesthetic viewpoint—some technical papers are not aesthetic).
I tend to over-analogize but the equation for d^2 I /dt^2 (5th equation) looks almost like a hamilton-Jacobi or geodesic equation
.
The 8th equation for I* looks like a kind of entropy.
There are old papers from 1990’s by P Antonelli of U Alberta Canada i in Bull Math Biol which use Reimann of Finsler geometry to describe ecology of coral reefs. They go from some variant of (stochastic) lotka-Volterra equations, and then rewrite them as fokker-plank type equations with a reimann metric as the difusion coefficient, and also show these can be derived from ‘stochastic hamiltonians’ and lagrangians.
I think I saw this formalism first in papers by H Haken and R graham of the german ‘synergetics’ school of nonequilibrium statistical physics (in a paper in Rev of modern Physics in 1970s).
There are related formalisms e.g. ‘doi-peliti- method ‘ (mentioned in an earlier blog post on this site) and https://arxiv.org/abs/0810.0817 .
I just found it interesting that ecological and statistical or thermodynamic systems could be written in ways that look like newtonian mechanics or general relativity. Verlinde’s ‘entropic gravity’ seems to derive general relativity from the 2nd law of thermodynamics or a MaxEnt principle (and other papers also use something like MaxEnt or ‘information geometry’ to derive newtonian or relativistic mechanics. . (In my original physics classes, we were basically told that thermodynamics and mechanics were basically ‘opposites’.. But a paper by D Ludwig I came across on population genetics —wright-fisher equations—used the synergetics formalism to make ‘hill climbing’ on a ‘fitness landscape’ look analagous to a particle’s motion on a potential energy ladscape–just turned upside down.)
I don’t really understand these formalisms.
(My own COVID test came back negative to my surprise. I almost don’t believe it,. I also thought i had a temperature but was told i didn’t have one.
It is interesting that up until recently people were saying COVID was no worse than the common flu, but the ‘excess deaths’ now seem to have exceeded that by 4 fold for USA.
I give Trump credit for at least taking that drug he was promoting (if he is)—‘walking the talk’. I’m in contact at times with enough people into all kinds of ‘alternative medicine ‘ that I sometimes (or always) don’t know what to believe.
On just about every other issue I disagree with Trump–especially the environment an probably taxes–those seem to be easy. )
LikeLike
@ishi If you had a SARS-CoV-2 PCR test, the false negatives are pretty high so there is still a chance you have it, or you may have had it and now the viral load is below the sensitivity of the test. You could try to get an anti-body test in the summer. As for all equations looking the same as other equations, it all comes down to the assumption of smoothness in physics. If functions are mostly smooth, then the first two derivatives are all that matter. Hamiltonian dynamics are second order because it is dynamics with conservation conditions, namely energy and momentum, which can be viewed geometrically as dynamics on a symplectic manifold, which is a fancy way of saying that oriented volume is preserved. Any system of dynamical equations, can always be written as a gradient of some potential function and thus we can always reframe dynamics in scheme that looks like Hamiltonian mechanics. Thermodynamics and mechanics are not opposites at all. They both just have their own potentials. Mechanics have an action (in terms of the Lagrangian or Hamiltonian) and Thermodynamics have a free energy. Stochastic dynamics is just conserved motion in a probability space and thus it can also be cast into the same language.
LikeLike
Carson Chew– thats a very good response–much appreciated.
I still self-quarantine and wear a face mask unless there are basically no people around. ‘False negatives’ i view as very possible—i’m impressed by the tests and labwork used to make them, and the doctor/nurses who gave me one— but also have heard these are not perfect. so i still wear a mask if i’m outside and quarantine for now. maybe get another test in summer.
Since i listen to alot of radio at times its interesting that alot of talk radio has people on it saying ‘you don’t need to wear a face mask’.
I just view it as a precaution–moslty not to infect others. Even small children in this area are wearing masks.)
——
Your summary answer to my questions about thermodynamics and mechanics i think basically say what was my intuition. I tried to read some books on symplectic manifolds but the formalism was above me. I just remember in my basic physics courses we were told thermodynamics and mechanics were ‘opposities’—one dealt with deterministic, conservative systems, while the other dealt with stochastic and open systems.
on a related note i shared your 2013 arxiv paper on ‘fisher’s additive effect’ with j lee with a semi -amatuer scientist .
he says he has a phD in physics but it would be in an experimental field and he decided to write a paper on biological group selection using a book on ‘darwinian dynamics’ by vincent and joel brown (michod has an earlier one with similar title — he posted his paper on a SFI FB group. his main point was ‘non-additivity’ so i sent him the link to your paper . this is a fairly well traveled road (his view was he had discovered something new. queller also went through this decades ago though i’ve never actually seen his papers. ) Michod has a review in Quart Rev Biol from 1980s free on line which goes through an outline of statistical thermodynamics of evolution.
LikeLike
the covid-19 plateau is quite interesting but I can’t help feeling that the feedback between cases and social distancing is too slow to explain the plateau. Most, people have had a fixed social distancing after the lock down. Certainly, they are not adjusting to the case number on a continual basis. Also, if they were indeed doing this then we will see the plateau on the scale of individual states or countries. But most countries have a characteristic fast rise and slow decay. The flattening is only seen on the global scale, which is precisely the scale that is most insensitive to the feedback. Now, if we analyze the number of new cases in the US it is decaying slowly. This is mostly due to the fast decay at the hot spots (NY, NJ,…) added to the rapid rise in newer areas. The slow decay seems to me a spatial effect due to individual cities being hit at different times. It is very likely that the plateau on the global scale is temporary. The dynamics on the global scale is so much slower than the local so any patterns that we see on a scale of a month or so do not reflect any intrinsic dynamics of the system.
LikeLike
[…] re-emergence. As long as new cases are increasing or plateauing, R0 remains above 1. As I mentioned before, plateauing is not a natural feature of the epidemic prediction models, which generally either go […]
LikeLike
[…] will do. This was pointed out by economist John Cochrane months ago, which I blogged about (see here). You can see why getting behavior correct is crucial to modeling a pandemic from the classic SIR […]
LikeLike